ページの本文です。
更新日付:2021年6月28日 / ページ番号:C081782
Saitama City Inland Water Hazard Map【English】
What is Inland Water Hazard Map?
This Inland Water Hazard Map shows the inundation area and depth of inundation that can be anticipated in the occurrence of inland water flooding caused by heavy rainfall that exceeds the drainage capacity of the sewerage system, based on inundation simulation.
It was prepared with the aim of promoting self-help and mutual-help among citizens by helping them prepare for everyday needs and evacuation.
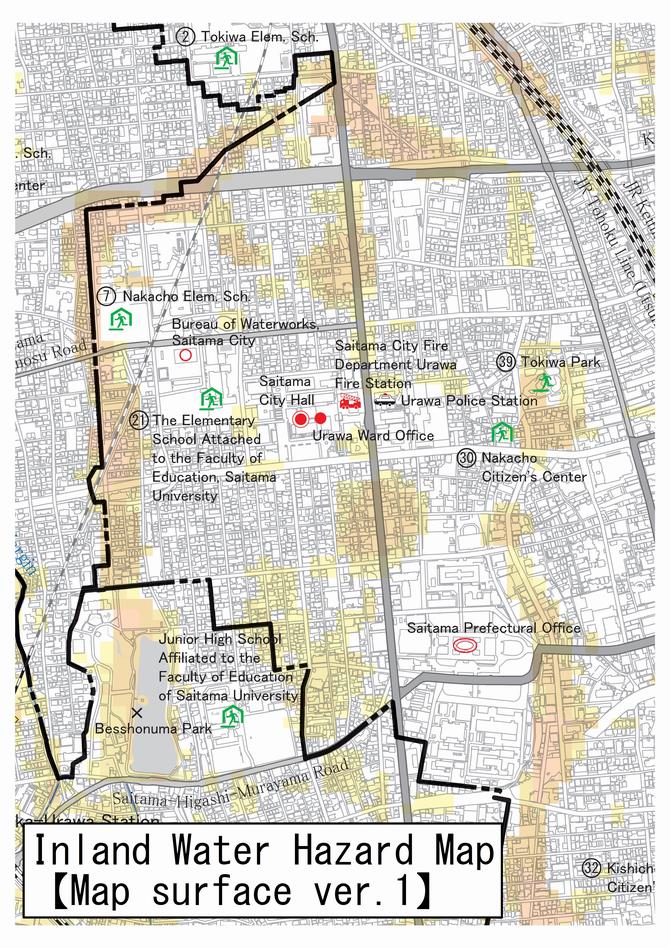
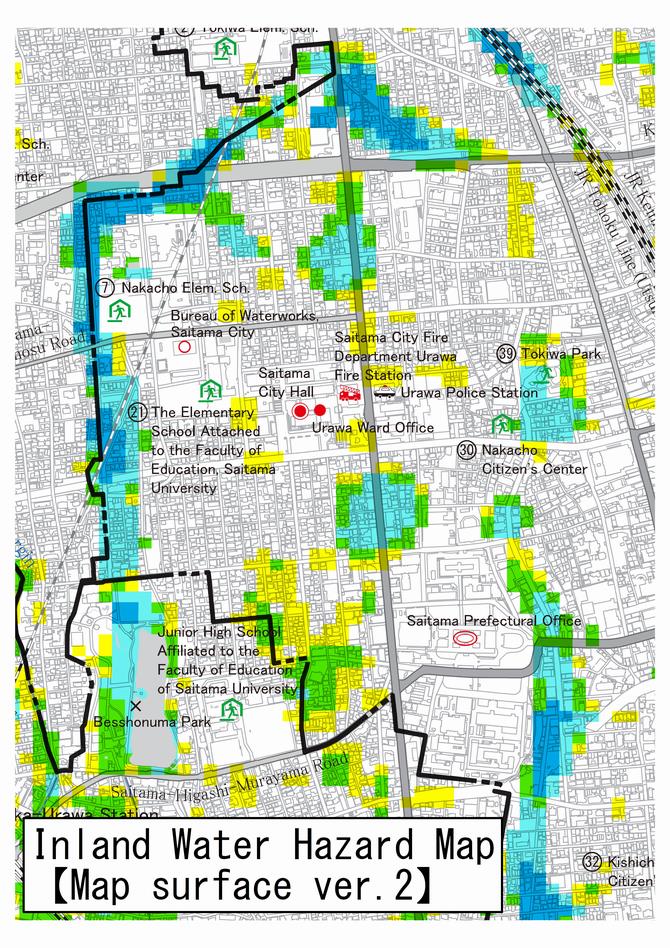
On this map's surface, the assumed inundation depths from 20 cm to more than 5 m are color-coded in six levels and indicated by a 25 m × 25 m square.
Please check the depth of inundation in your area and make sure you have a safe evacuation route to move to.
Consider multiple evacuation routes, as the flooded area and depth of flooding may differ from the map due to rainfall and changes in the shape of the land.
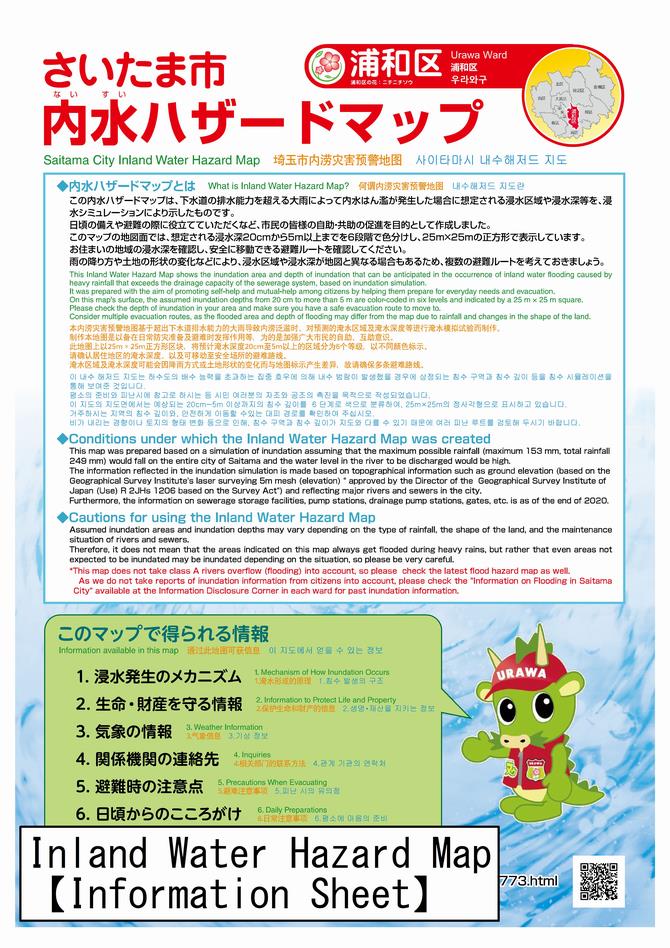
Conditions under which the inland water hazard map was created.
This map was prepared based on a simulation of inundation assuming that the maximum possible rainfall (maximum 153 mm, total rainfall 249 mm) would fall on the entire city of Saitama and the water level in the river to be discharged would be high.
The information reflected in the inundation simulation is made based on topographical information such as ground elevation (based on the Geographical Survey Institute's laser surveying 5m mesh (elevation) " approved by the Director of the Geographical Survey Institute of Japan (Use) R 2JHs 1206 based on the Survey Act") and reflecting major rivers and sewers in the city.
Furthermore, the information on sewerage storage facilities, pump stations, drainage pump stations, gates, etc. is as of the end of 2020.
Cautions for using the Inland Water Hazard Map.
Assumed inundation areas and inundation depths may vary depending on the type of rainfall, the shape of the land, and the maintenance situation of rivers and sewers.
Therefore, it does not mean that the areas indicated on this map always get flooded during heavy rains, but rather that even areas not expected to be inundated may be inundated depending on the situation, so please be very careful.
This map does not take class A rivers overflow (flooding) into account, so please check the latest flood hazard map as well.
関連ダウンロードファイル
 Nishi Ward_Inland Water Hazard Map【Information Sheet】(PDF形式 3,531キロバイト)
- Nishi Ward_Inland Water Hazard Map【Map surface 1】(PDF形式 15,235キロバイト)
- Kita Ward_Inland Water Hazard Map【Information Sheet】(PDF形式 3,519キロバイト)
- Kita Ward_Inland Water Hazard Map【Map surface 1】(PDF形式 14,168キロバイト)
- Omiya Ward_Inland Water Hazard Map【Information Sheet】(PDF形式 3,491キロバイト)
- Omiya Ward_Inland Water Hazard Map【Map surface 1】(PDF形式 18,509キロバイト)
- Minuma Ward_Inland Water Hazard Map【Information Sheet】(PDF形式 3,499キロバイト)
- Minuma Ward_Inland Water Hazard Map【Map surface 1】(PDF形式 14,958キロバイト)
- Chuo Ward_Inland Water Hazard Map【Information Sheet】(PDF形式 3,492キロバイト)
- Chuo Ward_Inland Water Hazard Map【Map surface 1】(PDF形式 19,123キロバイト)
- Sakura Ward_Inland Water Hazard Map【Information Sheet】(PDF形式 3,497キロバイト)
- Sakura Ward_Inland Water Hazard Map【Map surface 1】(PDF形式 18,071キロバイト)
- Urawa Ward_Inland Water Hazard Map【Information Sheet】(PDF形式 3,501キロバイト)
- Urawa Ward_Inland Water Hazard Map【Map surface 1】(PDF形式 19,652キロバイト)
- Minami Ward_Inland Water Hazard Map【Information Sheet】(PDF形式 3,496キロバイト)
- Minami Ward_Inland Water Hazard Map【Map surface 1】(PDF形式 15,843キロバイト)
- Midori Ward_Inland Water Hazard Map【Information Sheet】(PDF形式 3,499キロバイト)
- Midori Ward_Inland Water Hazard Map【Map surface 1】(PDF形式 20,087キロバイト)
- Iwatsuki Ward_Inland Water Hazard Map【Information Sheet】(PDF形式 3,514キロバイト)
- Iwatsuki Ward_Inland Water Hazard Map【Map surface 1】(PDF形式 20,188キロバイト)
- 10 Ward_Inland Water Hazard Map【Map surface 2】(PDF形式 10,708キロバイト)
![]()
PDFファイルの閲覧にはAdobe Reader(無償)が必要です。同ソフトがインストールされていない場合には、Adobe社のサイトからAdobe Readerをダウンロードしてください。
この記事についてのお問い合わせ
建設局/下水道部/下水道計画課 計画第1係
電話番号:048-829-1566 ファックス:048-829-1975